
Shiny Web App to visualize key financial metrics
Shiny for Python is now available in the alpha stage and this article will guide you in the usage of the framework. Furthermore, I use this post to introduce some knowledge of key financial indicators that are used in value investing. The idea is to be able to research companies with competitive advantages using only six key indicators that are used by the well-known fathers of Value Investing like Warren Buffet and Ben Graham.
Shiny for Python and Shiny in R are almost identical
I will explain each of the indicators plus I will share step-by-step the code that was used in this little project. But first of all, I need to clarify that you need to have access to Financial Model Prep API (FMP). You should create an account or log in to the website if you are looking to follow the steps explained in this post or, if you wish, you could just modify this dashboard and create a new one with annual data that is free with limited numbers of API calls in FMP. The project could be cloned from this URL: https://github.com/octadelsueldo/ValueInvestingDashboard
The goal of the investment dashboard, following a value investment philosophy, is to find:
Profitable Companies
With low Debt
That provides value to their investors (positive EVA)
Without the risk of bankruptcy (Altman Z-Score)
Without earnings manipulation (Beneish Score)
What metrics should we use?
Operative Margin
Is this company capable of consistently generating a positive operative margin in their business activities?
The operating margin measures how much profit a company makes on a dollar of sales after paying for variable costs of production, such as wages and raw materials, but before paying interest or tax. It is calculated by dividing a company’s operating income by its net sales. Higher ratios are generally better, illustrating the company is efficient in its operations and is good at turning sales into profits.
We want to invest in companies that are capable of growing, so here we will look forward to checking the slope of the operative margin. We need to reach a positive slope to approve the company as profitable over the years.
Debt rate
Total debt relative to the amount originally invested by the owners
The debt-to-equity ratio measures your company’s total debt relative to the amount originally invested by the owners and the earnings that have been retained over time. Bear in mind that in this case, we are looking for a debt-to-equity rate that is below 0.5 to reach our target
Retained Earnings
Retained earnings (RE) are the amount of net income left over for the business after it has paid out dividends to its shareholders.
Retained earnings are the cumulative net earnings or profits of a company after accounting for dividend payments. As an important concept in accounting, the word “retained” captures the fact that because those earnings were not paid out to shareholders as dividends, they were instead retained by the company.
For this reason, retained earnings decrease when a company either loses money or pays dividends and increase when new profits are created. To pass the value investing test of retained earnings, here we need a company that has a power of the slope of retained earnings above 0. This is the measure we want to reach.
EVA
EVA shows how and where a company created wealth, through the inclusion of balance sheet items.
EVA is the incremental difference in the rate of return (RoR) over a company's cost of capital. Essentially, it is used to measure the value a company generates from funds invested in it. If a company's EVA is negative, it means the company is not generating value from the funds invested into the business. Conversely, a positive EVA shows a company is producing value from the funds invested in it. In this case, we are looking for companies that provide value to their investors over the last 10 years. So despite the fact that we need to check the last period as the most important, we need to revise the whole period with positive EVA.
The formula for calculating EVA is:
EVA = NOPAT - (Invested Capital * WACC)
Altman Z-Score
The formula takes into account profitability, leverage, liquidity, solvency, and activity ratios.
The Altman Z-score is the output of a credit-strength test that gauges a publicly traded manufacturing company's likelihood of bankruptcy.
The formula takes into account profitability, leverage, liquidity, solvency, and activity ratios. An Altman Z-score close to 0 suggests a company might be headed for bankruptcy, while a score closer to 3 suggests a company is in a solid financial position.
Beneish Score
if a company scored greater than -2.22 (i.e. a less negative or positive number) there was a likely probability of profit manipulation.
Beneish’s M-Score is a mathematical model that uses eight financial ratios weighted by coefficients to identify whether a company has manipulated its profits. It was created by Professor Messod Beneish who published a paper in June 1999 called The Detection of Earnings Manipulation. Beneish surmises that companies are incentivized to manipulate profits if they have high sales growth, deteriorating gross margins, rising operating expenses, and rising leverage. They are likely to manipulate profits by accelerating sales recognition, increasing cost deferrals, raising accruals, and reducing depreciation.
Beneish concluded that if a company scored greater than -2.22 (i.e. a less negative or positive number) there was a likely probability of profit manipulation.
The Web App
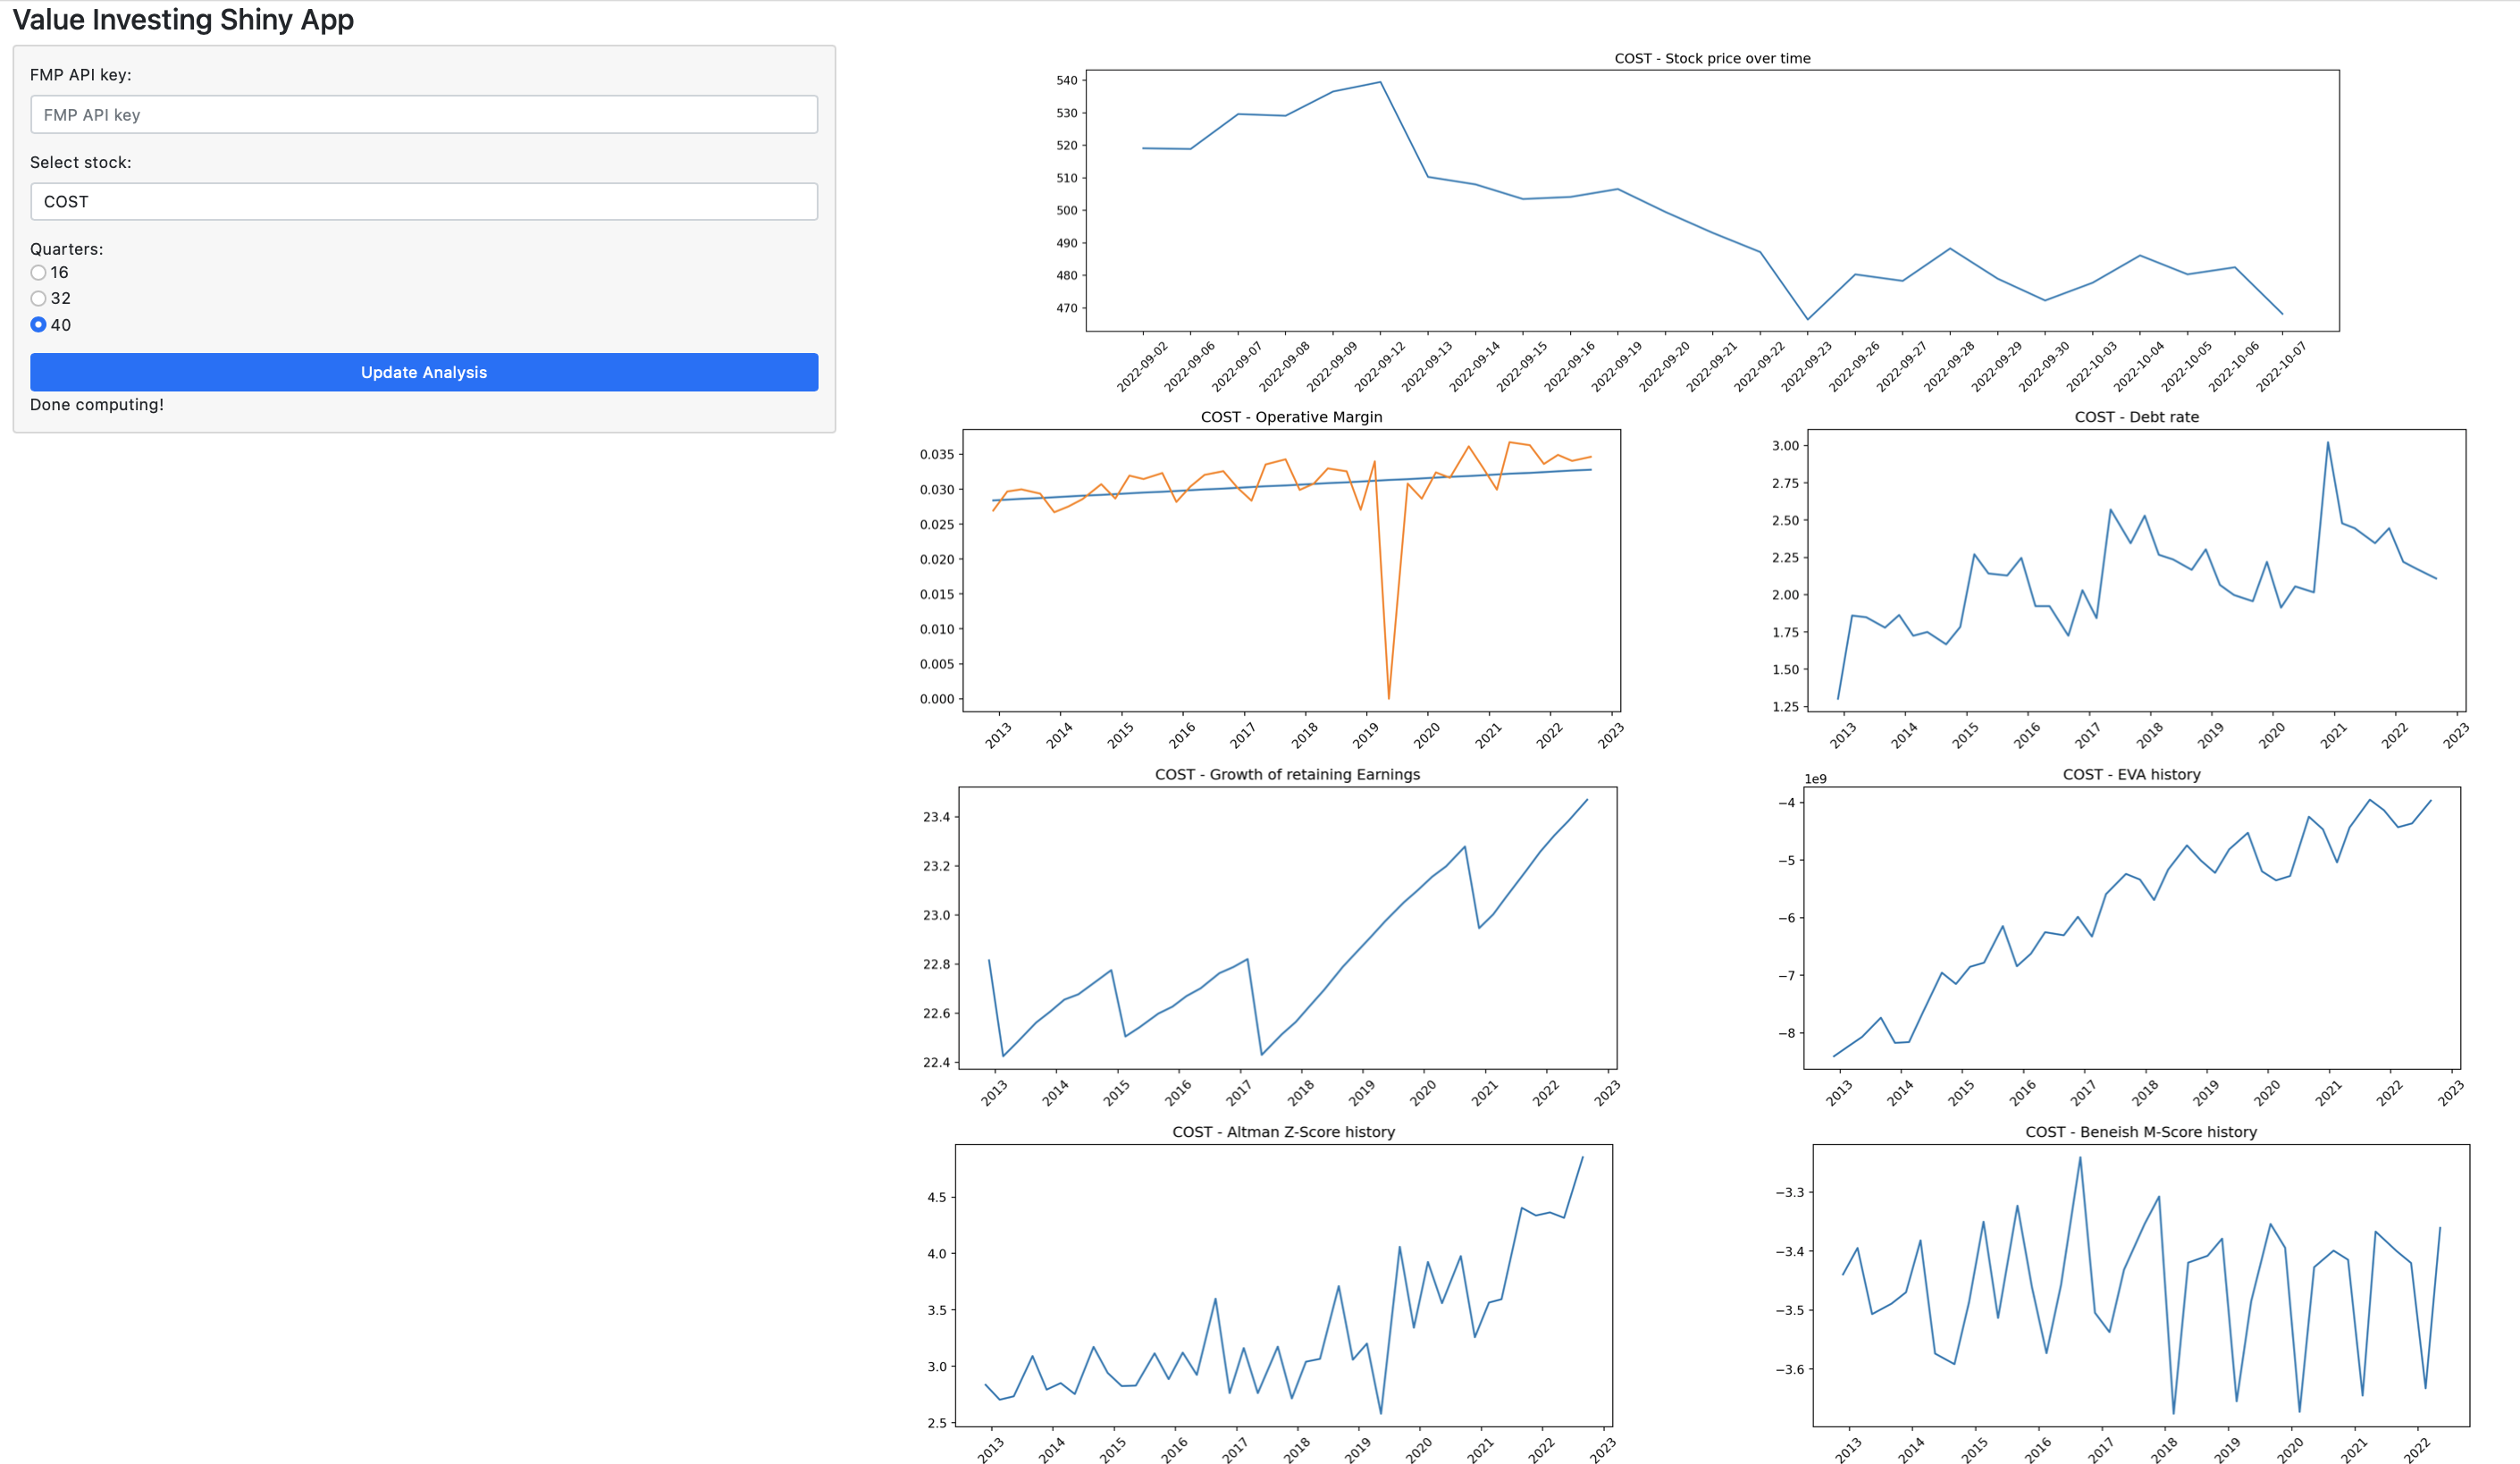
The panel sidebar consists of two text inputs for the FMP API key, the ticker, and one radio button input to choose the number of quarters to be retrieved.
The main panel consists of 6 plots. First of all the price over time shows the tendency of the stock price. Next we have the Key financial indicators presented in different rows and columns side by side. Here, down below, you can see a block of code with the first lines of the Shiny App.
On the side of the server (where magic happen), we will be calling the FMP API to call the financial statements such as the income statement, balance sheet, different financial ratios, etc. Additionally, I added a reactive values that will be updated each time we press the buttom input "input_action_button". This reactive values will help us when we would like to update the plots for a different stock. I mean this object will be converted in a reactive dataset that are updated each time we update the button, so when they are updated, our plot understand that the stock just changed and the reactive dataset was updated so the plots will changed accordingly.
To conclude You should now be able to go through your favorite stocks and rapidly get a sense of their value indicators to make an investment decision with fundamentals.
The metrics were selected based on value investing books and courses , but you should be able to replace them by others of your preference. I also recommend you to use a screener like yahoo finance, zacks u other to make a first filter companies based on their key indicators before you get into the shiny app to research the last 10 years.
I'’ll be adding new shiny apps with additional charts and test to go deep in the value investing analysis in my next posts. Please feel free to tell me a suggestion or a feedback about the post.
References:
https://www.gmtresearch.com/en/accounting-ratio/beneishs-m-score/
If you are new to Medium you can join by following this link.
A small part of your membership will support my writing and the other talented writers on this platform.
Originally published at https://www.octaviods.com on October 10, 2022.